Automate topology optimization designs with nTop Automate
Written by Evan Pilz | Application Engineer
Published on October 12, 2020
The goal of every design engineer is to create the best possible part in the least amount of time. The Command Line Interface of nTop (nTop Automate) offers the ability to do just that. In this article, we’ll go through an example. I’ll show you how to leverage design automation to cut in half the time it takes to perform a comprehensive topology optimization study.
Applications
Key Software Capabilities
- Topology optimization
On nearly a daily basis we talk with engineers from the automotive and aerospace industries who want to design the highest-performing parts. This conversation usually includes some talk about structural lightweighting. This makes a lot of sense. You need to have not only a product that does its job well but also a product that does its job with additional and tangible benefits over the previous generation or competition.
For organizations that want to produce the highest quality parts by squeezing out every possible bit of performance, there is one method that has risen in popularity: topology optimization. It enables design engineers to create high-performing, organic designs with relative ease.
In the beginning, the biggest pain points were the necessary computing power, the computation time, and the difficulty of producing a usable geometry. Now, computers have gotten exponentially more powerful and current software tools have made it easy to set up a basic optimization workflow — even for a novice.
But there are still many caveats to getting the most out of topology optimization. For example, how can you adjust and control the massive amount of input parameters of a topology optimization workflow? With so many choices — and combinations — that affect the outcome, it is hard to know if what you have chosen results in something truly optimal.
Traditionally, to solve this problem an engineer must manually create a multitude of design variations and run simulations to compare the results. This manual process takes hours of hands-on work that could be better spent elsewhere.
Here is the key question: How can we limit the amount of manual design work while also ensuring the best possible result?
Well, that's simple: design automation.
Avoiding the limitations of time and compute power
nTop not only has the ability to rapidly generate geometry with a complexity that design engineers only used to dream of but also it offers the option to automate design exploration steps through the use of nTop Automate.
Let’s follow a basic topology optimization workflow example to see, in action, how the nTop Automate can automate and accelerate your design process.
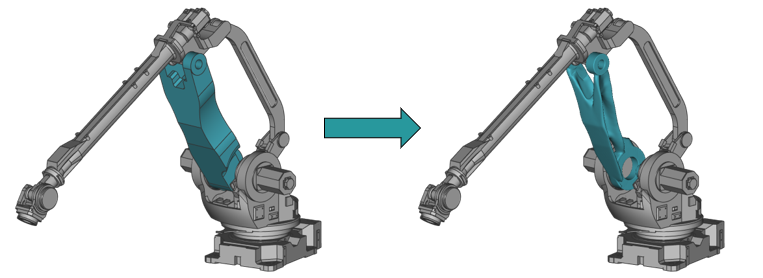
Figure 1: Robot arm assembly with the design space (blue) before and after topology optimization in nTop.
In the figure above, we have an assembly of a robotic arm. The specific part that we want to optimize is highlighted in blue. The first step in the workflow is to convert the initial CAD geometry into a volumetric mesh, apply the known loading cases, and run a topology optimization. From there the “raw” topology optimization result needs to be smoothened in order to remove potential stress concentrations and other problem areas. Then the resulting smooth body is then joined back with the necessary connection geometry. This final resulting body is then meshed for a post-shape analysis. All of the steps in this workflow can be seen in the image below.

Figure 2: The steps of the workflow from initial CAD to final stress analysis.
To create this optimized body in the workflow there is a multitude of inputs that affect the final outcome, the focus here is on one specific input: boundary penalty.
The boundary penalty is a parameter of the topology optimization process that can be adjusted between 0 and 1. Technically speaking, if a value of 0 is chosen there is no penalty enforced on the formation of elements along the boundary (i.e. the Nuemann criteria), and if a value of 1 is chosen, material formation on the boundary is completely restricted where no boundary conditions are applied (i.e. the Dirchelet criteria). Any value between 0 and 1 will apply a partial restriction. In other words, if a value of 0 is chosen more material will exist on the boundary of the part whereas if a value of 1 is chosen material will tend to form inside the volume more. This input can have a massive impact on the maximum stress value and appearance of our final result.
To find the best possible value for the boundary penalty, we need to test every value between 0 and 1. Of course, we can do this manually, but if we want to test in increments of 0.1 that requires the creation of 11 iterations. For an advanced optimization workflow, like the one in this example, each iteration can easily take several hours to complete. That is a lot of time for an engineer to dedicate to a single project.
However, if we’d make use of the nTop Automate the same process can run totally hands-free (and even outside of business hours) creating a DoE to evaluate many variants and select the best option.
Leveraging design automation with the nTop CLI
nTop Automate allows you to automatically run multiple iterations of a design workflow. It also allows you to run nTop headlessly, meaning that no graphics will be rendered. This speeds up the process even further. The workflow can run directly from the command line using simple commands, or by writing a Python or MATLAB script.
Of course, if your goal is to automatically run several iterations of a workflow, using something like a Python script is much handier. In this script, the values of the input parameters for each iteration are defined. In each loop, a new instance of the workflow will run. With the Python script written and the inputs defined everything is ready to go. All that is left is to run the script.
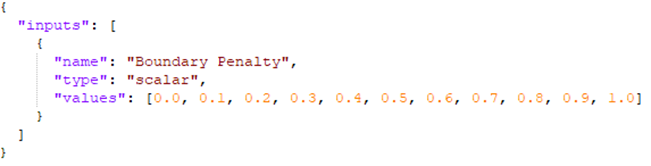
Figure 3: Input JSON file containing the values for the Boundary Penalty input.
In total, it took a little over 6 hours to run all 11 iterations of this script, all on a local computer, so sensitive files didn’t reside in the cloud. This was done overnight, freeing up more time for other projects. Once back at the desk the following morning the results are ready and waiting.

Figure 4: Visualization of the changing location of material formation depending on the value of the boundary penalty input.
All of the steps in the workflow were run automatically, including a step to export CAD and mesh representations of each iteration’s resulting geometry. A comparison of the final geometries can be seen in the figure above. The script also generated important data points to make easier the comparison of the results. The graph below compares the input value for the boundary penalty against the maximum stress in the final optimized geometry.

Figure 5: Graph created by the python script comparing the input value of the boundary penalty against the maximum stress in the optimized geometry.
This data illustrates the effect the boundary penalty input can have on the optimization process. While not massive (in this example, the range was approximately 2 MPa), these differences matter, when trying to create the highest performing part possible. A difference of 2 MPa may mean additional weight could be cut from certain locations while still achieving stress below an allowable limit. We all know collective weight savings can increase the speed in a race car or increase fuel performance. For parts destined for high orbits or deep space, each pound saved can translate to ~$20,000 saved or more. So while 2 Mpa may not immediately seem like a big deal, it can translate to big savings.
The graph also makes it very easy to see that the optimal value for the boundary penalty is 0 for this optimization. Based on this information, there is no need to explore other options as we have already identified the best value. Any further design work done on this part can be spent on finalizing small details with the knowledge that the part being created is the final design.
Key takeaways
nTop gives you access and full control of powerful topology optimization tools. When coupled with nTop Automate these advantages become supercharged. In this example, 11 variations of a design optimization workflow notebook ran overnight. The workflow automatically performed topology optimization, reconstructed the produced geometry, and ran a static FE analysis. Automating this process allowed for the most optimal geometry to be found without costing days of work for the engineer.
nTop Automate was used to evaluate the effect of one of a multitude of potential inputs. It can also be used to do a full DoE in order to automatically find the best combination of input values, saving massive amounts of time.

Evan Pilz
Application Engineer
Evan is a mechanical engineer with a focus in additive manufacturing from the University of Pittsburgh. Evan has worked with nTop in the past and has now joined the team as an Application Engineer.


